【注意】最后更新于 January 28, 2022,文中内容可能已过时,请谨慎使用。
多看、多问、多总结,肯定是可以攻克的。
文章结构
http://127.0.0.1:1313/post/oceanbase/2022-1-28_p6/
实践练习六(必选):查看 OceanBase 执行计划
环境说明
 1
 2
 3
 4
 5
 6
 7
 8
 9
10
11
12
|
obd cluster display test
+---------------------------------------------+
|                   observer                  |
+-----------+---------+------+-------+--------+
| ip        | version | port | zone  | status |
+-----------+---------+------+-------+--------+
| 127.0.0.1 | 3.1.1   | 2881 | zone1 | active |
+-----------+---------+------+-------+--------+

 /etc/sysctl.conf
 fs.aio-max-nr = 1048576 ##文件系统最大异步io
 fs.file-max = 6815744 ##文件系统中文件的最大个数
|
一、 使用 BenmarkSQL 运行 TPC-C
1.1 准备:
创建tpcc租户(不建议用sys租户)
-
单机扩容
1
2
3
4
5
6
|
oceanbase默认sys租户使用了2.5-5个CPU,1G内存.剩余1.5个cpu 3G内存。
根本不够使用的。因此修改配置进行扩容

obd cluster edit-config test
obd cluster reload  test
obd cluster restart test
|
-
添加租户
 1
 2
 3
 4
 5
 6
 7
 8
 9
10
11
12
13
14
|
obclient -uroot@sys -h127.0.0.1 -P2881 oceanbase  # 这里没有obproxy,因此端口不是2883


#创建资源单元规格
create resource unit tpcc_unit_2c2g max_cpu=2, min_cpu=2, max_memory='2g', min_memory='2g', max_iops=10000, min_iops=1000, max_session_num=1000000, max_disk_size='10g';
#创建资源池
create resource pool tpcc_pool_test unit = 'tpcc_unit_2c2g', unit_num = 1;
#创建租户:
obclient -uroot@tpcc -h127.0.0.1 -P2881 -p123456 -Doceanbase
create tenant tpcc resource_pool_list=('sys_pool');
alter user root identified by '123456';
## 创建数据库
create database tpcc;
obclient -uroot@tpcc -h127.0.0.1 -P2881 -p123456 -Dtpcc
|
1.2. 操作过程
-
集群参数调优:无
-
设置事务超时时间
1
2
3
4
5
6
7
8
9
|
Worker 001: ERROR: Transaction is timeout

ob_query_timeout 用于设置查询超时时间,单位是微秒。

set global ob_query_timeout=36000000000;

ob_trx_timeout 用于设置事务超时时间,单位为微秒。

set global ob_trx_timeout=36000000000;
|
1.2 安装benchmarksql
 1
 2
 3
 4
 5
 6
 7
 8
 9
10
11
12
13
14
15
16
17
18
19
20
21
22
23
24
25
26
27
28
29
30
31
32
33
34
35
36
37
38
39
40
41
42
43
44
45
46
47
48
49
50
51
52
53
54
55
56
57
58
59
60
61
|
##java环境配置
yum install java-1.8.0-openjdk  java-1.8.0-openjdk-devel
java  -version
openjdk version "1.8.0_322"

## 下载benchmarksql
git clone https://github.com/obpilot/benchmarksql-5.0.git
/app/local/2022/benchmarksql-5.0

## 修改配置:
cd /app/local/2022/benchmarksql-5.0/run
cat  tpcc.props.ob

conn=jdbc:oceanbase://127.1:2881/tpcc?useUnicode=true&characterEncoding=utf-8
#这里没有obproxy jdbc 2283改为2281
user=root@tpcc
#tpcc租户 root用户
password=123456

## Build the schema and initial database load

sh runSQL.sh tpcc.props.ob sql.common/tableCreates.sql

./runSQL.sh props.ob ./sql.oceanbase/tableCreates.sql

Worker 001: Loading Warehouse      1 done
Worker 001: Loading Warehouse      2
Worker 001: Loading Warehouse      2 done

## 查看数据


obclient -uroot@tpcc -h127.0.0.1 -P2881 -p123456 -Dtpcc

MySQL [tpcc]> show tables;
+------------------+
| Tables_in_tpcc   |
+------------------+
| bmsql_config     |
| bmsql_customer   |
| bmsql_district   |
| bmsql_history    |
| bmsql_item       |
| bmsql_new_order  |
| bmsql_oorder     |
| bmsql_order_line |
| bmsql_stock      |
| bmsql_warehouse  |
+------------------+
10 rows in set (0.002 sec)

MySQL [tpcc]> select count(*) from bmsql_oorder;
+----------+
| count(*) |
+----------+
|    60000 |
+----------+
1 row in set (0.066 sec)
|
1.3 运行TPCC测试
sh runBenchmark.sh tpcc.props.ob
1
2
3
4
|
obclient -uroot@sys -h127.0.0.1 -P2881 oceanbase

alter system major freeze;
|
 1
 2
 3
 4
 5
 6
 7
 8
 9
10
11
12
13
14
15
16
17
18
|
cat runBenchmark.sh
source ./funcs.sh $1

sh runBenchmark.sh tpcc.props.ob

Term-00, Running Average tpmTOTAL: 14.43  Current tpmTOTAL: 96  Memory Usage: 111MB / 1928MB

17:22:44,157 [Thread-2] INFO  jTPCC : Term-00, Measured tpmC (NewOrders) = 8.81

17:22:44,157 [Thread-2] INFO  jTPCC : Term-00, Measured tpmTOTAL = 14.43

17:22:44,157 [Thread-2] INFO  jTPCC : Term-00, Session Start   = 2022-02-11 17:21:29

17:22:44,157 [Thread-2] INFO  jTPCC : Term-00, Session End    = 2022-02-11 17:22:44

17:22:44,158 [Thread-2] INFO  jTPCC : Term-00, Transaction Count = 17
|
二、分析 TPC-C TOP SQL,并查看 3条 SQL 的 解析执行计划 和 实际执行计划。
2.1 查询TOP3 sql 实际执行计划
 1
 2
 3
 4
 5
 6
 7
 8
 9
10
11
12
13
14
15
16
17
18
19
20
21
22
23
24
25
26
27
28
29
30
31
32
33
34
35
36
37
38
39
40
41
42
43
44
45
46
47
48
49
50
51
52
53
54
55
56
57
58
59
60
61
62
63
64
65
66
67
68
69
70
71
72
73
74
|
obclient -uroot@tpcc -h127.0.0.1 -P2881 -p123456 -Doceanbase
select/*+ parallel(15)*/ SQL_ID, count(*) as QPS, avg(t1.elapsed_time)/1000 RT_MS,sum(t1.elapsed_time)/1000 Total_MS
from oceanbase.gv$sql_audit t1
where IS_EXECUTOR_RPC = 0
and request_time > (time_to_usec(now()) - 600000000)
and request_time < time_to_usec(now())
group by t1.sql_id
order by Total_MS desc
limit 10;
SELECT sql_id, count(*), round(avg(elapsed_time)) avg_elapsed_time, round(avg(QUEUE_TIME)) QUEUE_TIME
round(avg(execute_time)) avg_exec_time,
s.svr_ip,
s.svr_port,
s.tenant_id,
s.plan_id
FROM oceanbase.gv$sql_audit s
WHERE request_time >= time_to_usec(DATE_SUB(current_timestamp, INTERVAL 30 MINUTE) )
GROUP BY sql_id
order by avg_elapsed_time desc limit 3;
*********************** 1. row ***************************
sql_id: F59A700FA168324279B0DBC25E19760F
count(*): 1
avg_elapsed_time: 640709
avg_exec_time: 635456
svr_ip: 127.0.0.1
svr_port: 2882
tenant_id: 1002
plan_id: 655
# EC66B09D06D688727D0F999BFCFF5348 为例子分析
## 查看sql
select distinct query_sql from gv$sql_audit where sql_id='EC66B09D06D688727D0F999BFCFF5348' \G;
select * from oceanbase.gv$sql_audit where sql_id='482BA7822AE7BE644CEBEB55213E7284' \G;
UPDATE bmsql_order_line SET ol_delivery_d = '2022-02-21 10:32:29.502'
WHERE ol_w_id = 1 AND ol_d_id = 1 AND ol_o_id = 2101
### OPERATOR Operator 的名称
SELECT sum(ol_amount) AS sum_ol_amount FROM bmsql_order_line WHERE ol_w_id = 2 AND ol_d_id = 1 AND ol_o_id = 2101
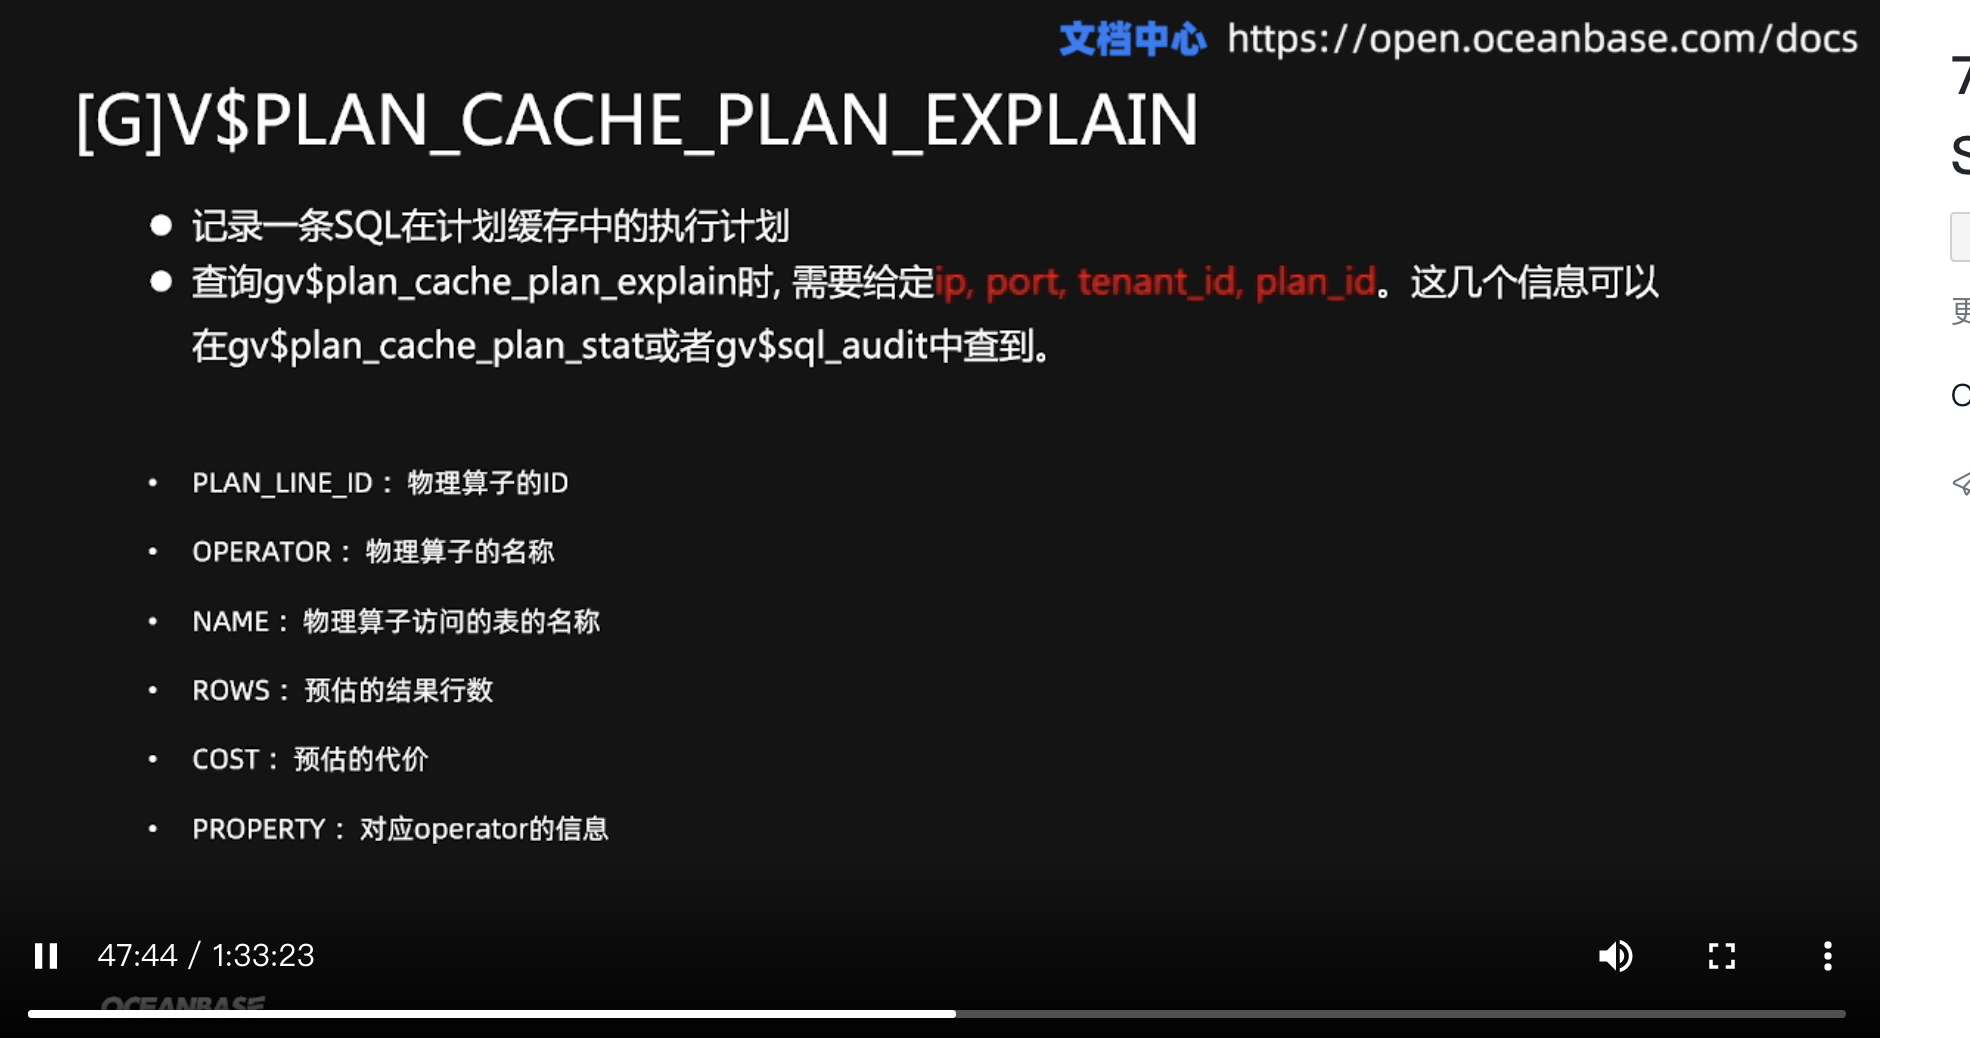
## 实际执行计划
SELECT ip, plan_depth, plan_line_id,operator,name,rows,cost,property from oceanbase.`gv$plan_cache_plan_explain`
where tenant_id=1002 AND ip = '127.0.0.1' AND port=2882 AND plan_id=667 \G;
*********************** 1. row ***************************
ip: 127.0.0.1
plan_depth: 0
plan_line_id: 0
operator: PHY_SCALAR_AGGREGATE 聚合操作
name: NULL
rows: 1
cost: 499581
property: NULL
*************************** 2. row ***************************
ip: 127.0.0.1
plan_depth: 1
plan_line_id: 1
operator: PHY_TABLE_SCAN 扫描
name: bmsql_order_line
rows: 11
cost: 499579
select * from oceanbase.gv$plan_cache_plan_stat where sql_id='482BA7822AE7BE644CEBEB55213E7284' \G;
//gv$plan_cache_plan_stat 视图记录了当前租户在所有 Server 上的计划缓存中缓存的每一个缓存对象的状态
|
 1
 2
 3
 4
 5
 6
 7
 8
 9
10
11
12
13
14
15
16
17
18
19
20
21
22
|
/app/local/2022/benchmarksql-5.0

sh runBenchmark.sh tpcc.props.ob

obclient -uroot@tpcc -h127.0.0.1 -P2881 -p123456 -Doceanbase

SELECT sql_id, count(*) cnt, round(avg(elapsed_time)) avg_elapsed_time,
    round(avg(execute_time)) avg_exec_time, s.svr_ip, s.svr_port, s.tenant_id, s.plan_id
FROM oceanbase.gv$sql_audit s
WHERE TENANT_NAME='tpcc' and DB_NAME='tpcc' and plan_id>0
GROUP BY sql_id
order by cnt desc limit 10 \G;
*************************** 1. row ***************************
          sql_id:
             cnt: 9460
avg_elapsed_time: 142
   avg_exec_time: 93
          svr_ip: 127.0.0.1
        svr_port: 2882
       tenant_id: 1002
         plan_id: 310
|
2.2 执行计划(没有执行)
- EC66B09D06D688727D0F999BFCFF5348 sql 为例子
 1
 2
 3
 4
 5
 6
 7
 8
 9
10
11
12
13
14
15
16
17
18
19
20
|
 explain SELECT sum(ol_amount) AS sum_ol_amount  FROM bmsql_order_line  WHERE ol_w_id = 2 AND ol_d_id = 1 AND ol_o_id = 2101 \G;

*************************** 1. row ***************************
Query Plan: ======================================================
|ID|OPERATOR       |NAME            |EST. ROWS|COST  |
------------------------------------------------------
|0 |SCALAR GROUP BY|                |1        |499691|
|1 | TABLE SCAN    |bmsql_order_line|11       |499689|
======================================================

Outputs & filters:
-------------------------------------
  0 - output([T_FUN_SUM(bmsql_order_line.ol_amount)]), filter(nil),
      group(nil), agg_func([T_FUN_SUM(bmsql_order_line.ol_amount)])
  1 - output([bmsql_order_line.ol_amount]), filter([bmsql_order_line.ol_o_id = 2101], [bmsql_order_line.ol_d_id = 1], [bmsql_order_line.ol_w_id = 2]),
      access([bmsql_order_line.ol_w_id], [bmsql_order_line.ol_d_id], [bmsql_order_line.ol_o_id], [bmsql_order_line.ol_amount]), partitions(p0)


select * from oceanbase.__all_virtual_lock_wait_stat \G
|
解释执行计划和实际执行计划也是相同的,都是全表扫描之后进行排序
-
TABLE SCAN — PHY_TABLE_SCAN
-
SCALAR GROUP BY—PHY_SCALAR_AGGREGATE
2.4 优化
小贴士:这里添加索引 并没有提高 为什么呢?
1
2
3
|
create index bmsql_customer_idx1 on bmsql_customer (c_w_id, c_d_id, c_last, c_first) local;
create index bmsql_oorder_idx1 on bmsql_oorder (o_w_id, o_d_id, o_carrier_id, o_id) local;
|
三、(可选)使用 OceanBase 的 Outline 对 其中一条 SQL 进行限流(限制并发为 1 )。
– 正在学习中
四、(可选)导入 TPC-H schema 和数据,数据量不用太大 100M 即可。查看 TPC-H 5条 SQL 的解析执行计划和实际执行计划。
– 正在学习中
五 、 学习笔记
视频资料:
OceanBase 功能和性能测试概述
https://open.oceanbase.com/docs/videoCenter/5900011
BenchmarkSQL是对OLTP数据库主流测试标准TPC-C的开源实现。目前最新版本为V5.0
该版本支持Firebird, Oracle和PostgreSQL
- 小王疑问:**TPC-C:**和TPC-H就差一个字,有什么区别?


BenchmarkSQL是通过jdbc连接各个数据库的。
需要下载客户连接jar lib/oracle/oceanbase-client-1.0.9.jar
obpilot已经完成。
add oceanbase configuration file (run/props.ob) and sql scripts (run/sql.oceanbase/*.sql) .
 1
 2
 3
 4
 5
 6
 7
 8
 9
10
11
12
13
14
15
16
17
18
19
20
21
22
23
24
25
26
27
28
29
30
31
32
33
34
35
|
db=oracle
driver=com.alipay.oceanbase.obproxy.mysql.jdbc.Driver
conn=jdbc:oceanbase://127.1:2881/tpcc?useUnicode=true&characterEncoding=utf-8
user=tpcc@oracle0_85#obv22_stable
password=123456

warehouses=2 //仓库数
loadWorkers=2//数据加载的性能

terminals=2 //客户端并发数
//To run specified transactions per terminal- runMins must equal zero
runTxnsPerTerminal=0
//To run for specified minutes- runTxnsPerTerminal must equal zero
runMins=1 //压测时间
//Number of total transactions per minute
limitTxnsPerMin=0

//Set to true to run in 4.x compatible mode. Set to false to use the
//entire configured database evenly.
terminalWarehouseFixed=true

//The following five values must add up to 100
newOrderWeight=45
paymentWeight=43
orderStatusWeight=4
deliveryWeight=4
stockLevelWeight=4

// Directory name to create for collecting detailed result data.
// Comment this out to suppress.
resultDirectory=my_result_%tY-%tm-%td_%tH%tM%tS
osCollectorScript=./misc/os_collector_linux.py
osCollectorInterval=1
|

.1 OceanBase 数据库 SQL 诊断和优化
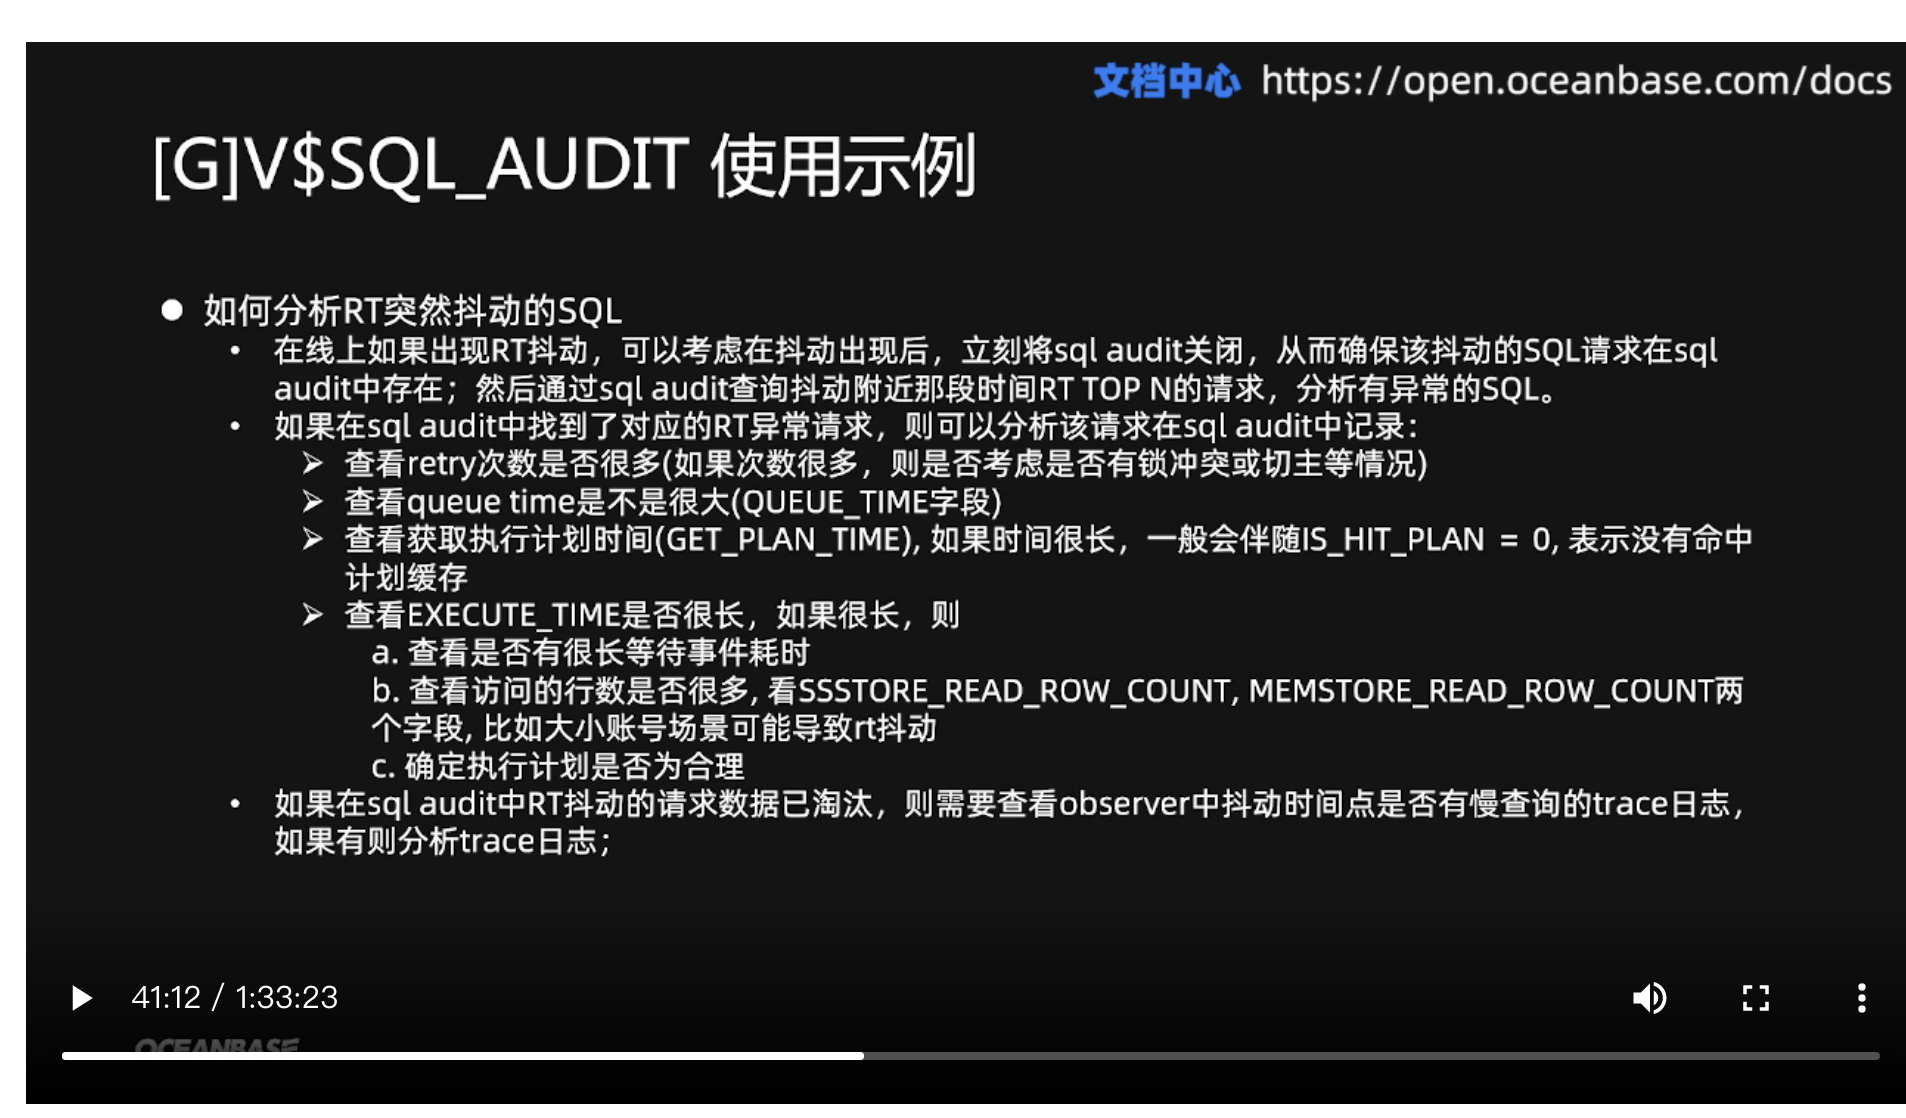
gv$sql_audit :视图用于展示所有 Server 上每一次 SQL 请求的来源、执行状态等统计信息
**gv$plan_cache_plan_explain **:该视图用于展示缓存在全部的 Server 中的计划缓存中的物理执行计划。
参考资料
