gperftools
2022-02-09 00:00
 次阅读
次阅读
次阅读
文章目录
【注意】最后更新于 February 9, 2022,文中内容可能已过时,请谨慎使用。
青铜提问1/100:如何用emacs搭建c++开发环境?
学习别人的思路:
- https://www.zhihu.com/question/51099641
- https://emacs-lsp.github.io/lsp-mode/tutorials/CPP-guide/
- https://www.cnblogs.com/flyingdirt/p/3399624.html
- https://github.com/purcell/emacs.d{web}
- https://www.cnblogs.com/GarfieldEr007/p/5588979.html
- https://www.zybuluo.com/qqiseeu/note/17692
小马过河:
-
todo1
-
我应一开始就照抄 世界级大师 Steve Purcell 的 Emacs 配置.
-
安心用 Steve Purcell 的 Emacs 配置 , 从此走上正轨.
-
初学者开始阶段应以模仿为主. 这点是本文核心思想.
-
|
|
- https://www.cnblogs.com/eat-and-die/p/10309681.html
- https://zhuanlan.zhihu.com/p/114329781
- https://github.com/redguardtoo/emacs.d
基本用法
|
|
- Perftools-Specific Install Notes
|
|
问题 cpu 高怎么解决
|
|
青铜提问1:
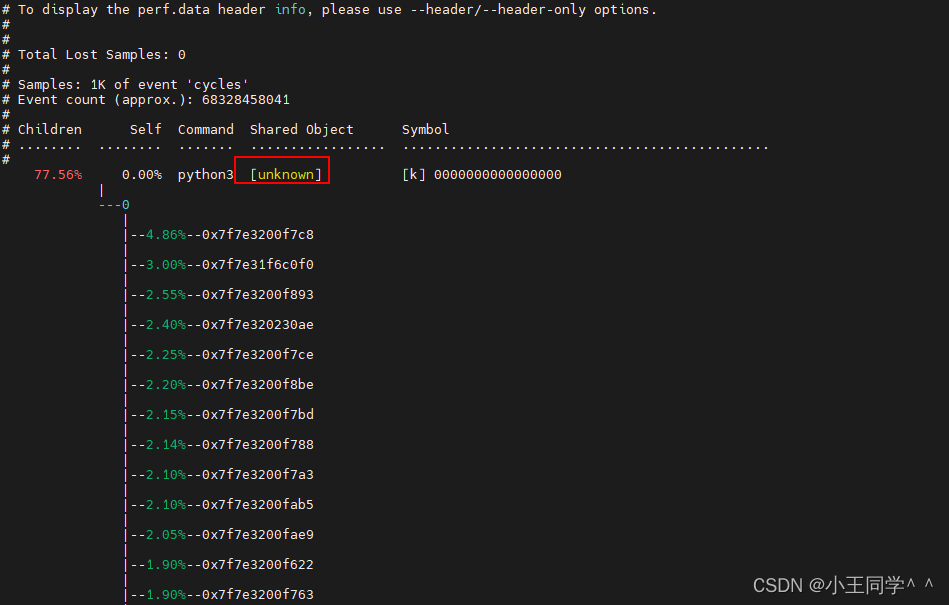
用perf report –stdio 跟踪看不到是地址,不是函数,如何根据 地址确定符号? python3调用了mpirun库
王者回答:
- https://github.com/freelancer-leon/notes/blob/master/kernel/profiling/perf.md
- https://www.mpich.org/downloads/
mpirun –version HYDRA build details: Version: 3.3.2 Release Date: Tue Nov 12 21:23:16 CST 2019